If you want to start trading with cryptocurrencies and make a profit, the first thing you need to do is learn how to read crypto charts and technical analysis. If you can do technical analysis by reading crypto charts well, you can be a successful and profitable trader. Continue reading the article to learn the basics and grasp the importance of Japanese candlestick charts, Dow Theory and indicators.
Markets have trends in all periods and typically behave highly similar during these periods. The primary market trend provides various signals to decide whether to buy or sell. This theory can be applied to the cryptocurrency market, taking into account all the variables when pricing. The price of a stock or cryptocurrency emerges as a reflection of all the details experienced so far. If you know how to read depth chart crypto, you can have an idea of where the price of the cryptocurrency will go. After recognizing the patterns of the cryptocurrency market, you are likely to predict whether the prices will move up or down with the market behavior.
What is technical analysis?
Technical analysis is a set of tools that allow the price of cryptocurrencies to be predicted for the future based on historical data. Those who know how to read a crypto depth chart can have good insights by doing good technical analysis. The first rule of thumb to do technical analysis is to study crypto charts. Crypto charts with dozens of elements can tell us a lot if they are well studied.
Differences between technical analysis and fundamental analysis
Technical analysis can be used for cryptocurrencies, commodities, stocks, futures and fiat currencies. Technical analysis, which has been developed over the years and includes currently known signals and patterns, was created by Charles Dow.
Fundamental analysis, on the other hand, is based on various information and news that are likely to affect the price of a cryptocurrency. Awareness, brand value, earnings and the updates it plans to bring can be listed as some of the factors that affect the fundamental analysis.
How to read crypto depth chart?
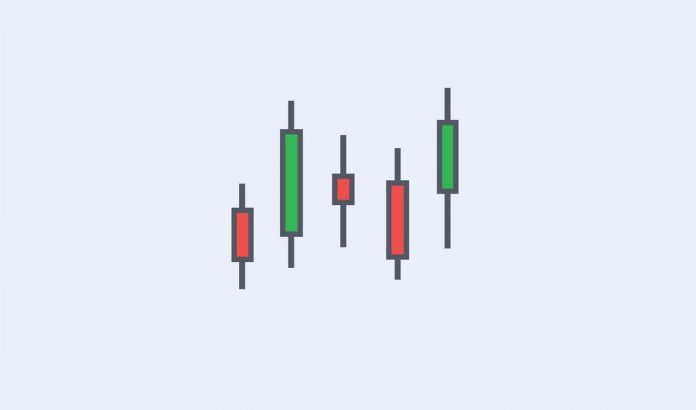
The most common type of crypto chart is the Japanese candlestick chart. Each candle we see on the coin’s chart against the pair shows price action over a specific time frame. Candles (also called boxes) have whiskers (also called shadows) on the top and bottom. This whisker represents the highest and lowest price seen during that time period. The box shows the difference between the opening price and the closing price. The box will be green if the price of the cryptocurrency has risen within that time frame, and red if it has fallen.
In order to predict how the price of the cryptocurrency will move in the market, you should analyze the candlesticks well.
Timeframes of cryptocurrency charts
Different timeframes can be used for candlesticks on the price charts of cryptocurrencies. Graphs can be created with time periods such as 1 minute, 3 minutes, 5 minutes, 15 minutes, 30 minutes, 1 hour, 4 hours, 1 day. If your plan is a short-term trading, you’d better choose a short timeframe. If you want to predict the long-term price of the cryptocurrency, you can also create a chart by choosing a longer timeline.
15-Minute Chart
Each is a 15-Minute Chart, meaning each candle represents 15 minutes, whether you’re looking for places to trade between targets and stop-loss exits.
Hourly chart
This is the most commonly used period.
Daily Chart (1 Day)
A daily chart shows data points, each reflecting the price action of the securities for a single trading day on live cryptographic charts.
Trader categories: Which are you?
A trader’s choice of time is strongly linked to his unique trading strategy. Traders are divided into two groups:
Intraday traders
As the name and definition indicate, intraday traders use charts for a short period of time, such as hourly charts.
Long term holders
Hourly, 4-hour, daily or weekly charts are the most valuable for these investors. A 15-minute chart can be an important indicator for intraday traders, but it may not be in the long run.
Market Volume
The standard cryptocurrency chart also shows market volumes. As you can often see in the how to read crypto charts YouTube videos, you can see how much trading activity has taken place in the selected time unit of the crypto currency you are interested in, in the market volume graph. A long volume bar means that investors are putting buying or selling pressure on the cryptocurrency. If the volume bar is green, the pressure is in the direction of buying, indicating that the coin has increased interest. A red volume bar highlights the selling pressure.
Support and Resistance Levels
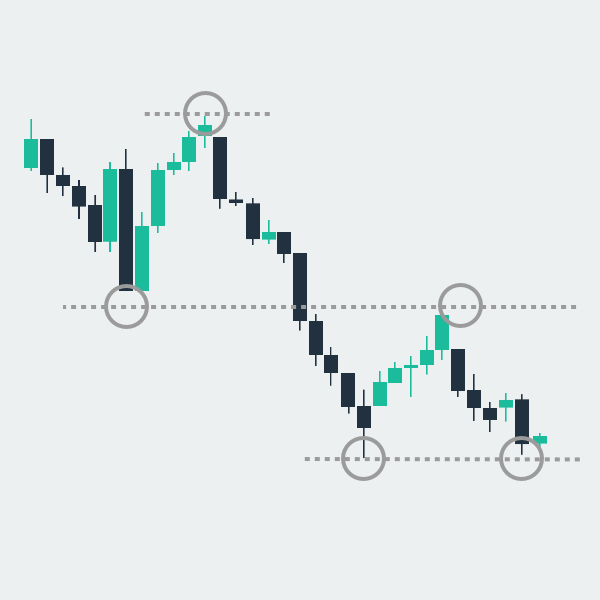
As in everything, it is not possible to constantly fall or rise in price in crypto coins. Where the price of the coin tends to stop falling is at the support level. Traders buy cryptocurrencies at the support level because it is assumed that the price of the coin will increase after this level.
The resistance level works as the opposite of the support level. It is assumed that a price rising towards the resistance level will not be able to break the resistance level, and the cryptocurrency will lose value after that level. Traders usually sell when the price reaches this level.
Support and resistance levels are easier to read with the use of trend lines. Trendlines are lines on charts that show the price trend by connecting prices over certain time periods. Simply chart the coin’s lowest and second-lowest prices over a given time period to draw a trend line. Draw a line that touches both. Levels that touch this line can act as support levels. This trendline is the uptrend line.
To draw a downtrend line, it is necessary to find the resistance levels. If you find the highest and second highest levels of the cryptocurrency and draw a line to touch them, you have created your trend line. You can create different strategies based on support levels, resistance levels and trendlines. If the price of the cryptocurrency moves strongly up or down, it can move forward by breaking the support or resistance level. Support and resistance systems should be determined using the moving average for long-terms. Thanks to the moving average, you can draw a trend line with a constantly updated price average.
Moving Averages
Moving averages serve to draw a smooth line by averaging the cryptocurrency’s prices over certain times. In this way, price fluctuations are reduced. That’s why one of the most widely used types of technical indicators is the moving average (MA). Moving averages can be used for 10-day, 20-day, 50-day, 100-day and 200-day periods. The simple moving average is called the SMA. With this average, you can easily divide the result by the number of periods by adding the average price of the cryptocurrency for a certain period.
The weighted moving average (WMA) becomes more sensitive as periods progress. In other words, it gives more weight to new price changes than old ones. The exponential moving average (EMA) works similarly, being sensitive to recent prices and the rate of change between two prices. However, all moving averages are based on past prices. That is why they can be called lagging indicators. You should use moving averages as signals to support technical analysis, not to create direct buy and sell orders.
For a golden cross to occur, the 50-day SMA must rise above the 200-day SMA. When this situation occurs, traders usually think that there will be a price increase.
Moving Average Convergence Deviation (MACD)
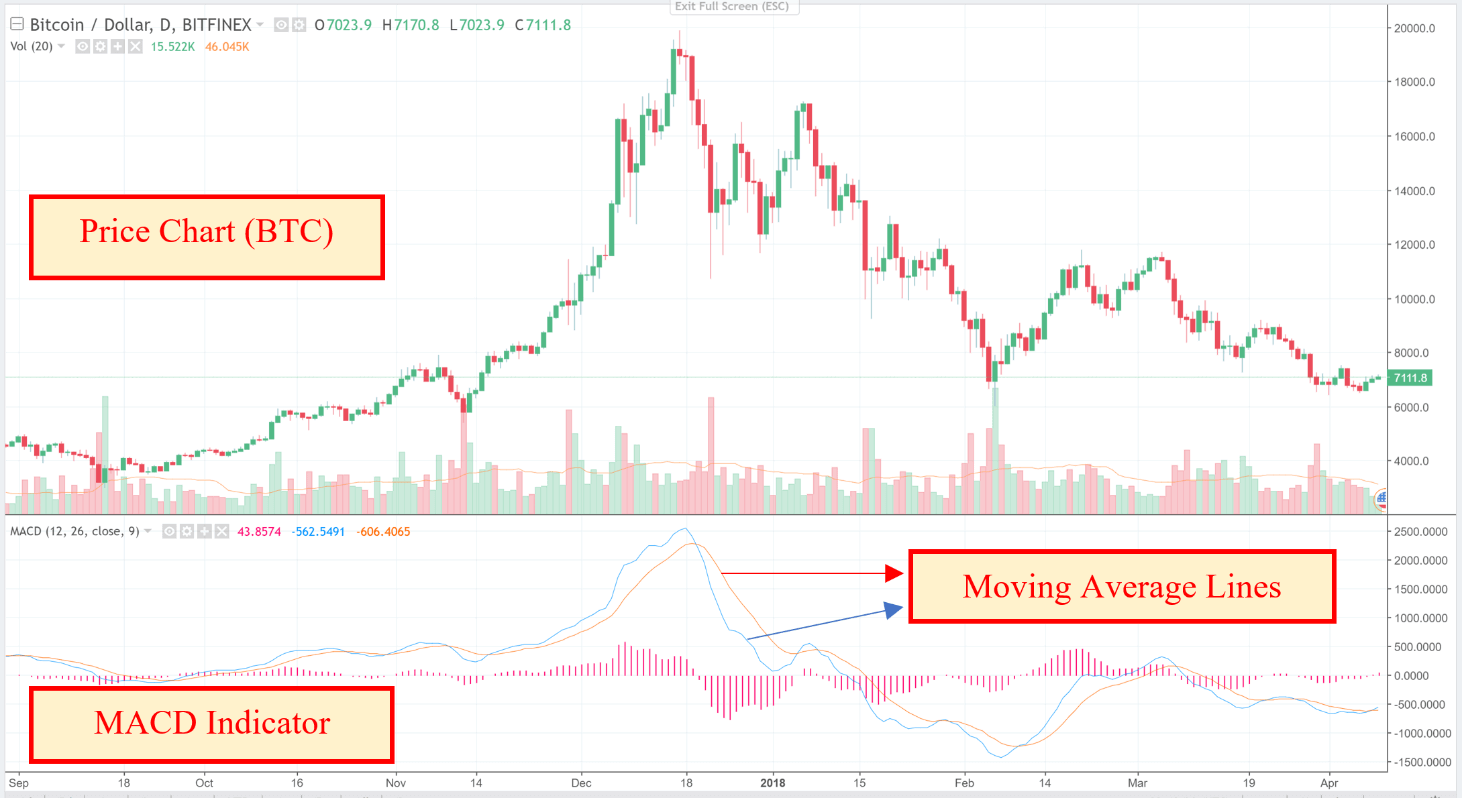
It is used to create the MACD line by measuring the difference between the 12-day and 26-day EMAs, and to identify buy and sell signals. The oscillator got its name because it is an indicator that fluctuates above and below a centered line. The MACD shows a buy signal when the 12-day EMA breaks above the 26-day EMA. A reverse signal tells it’s time to sell the cryptocurrency. The MACD indicator also displays a histogram chart to measure the difference between the signal line and the MACD.
Relative Strength Index (RSI)
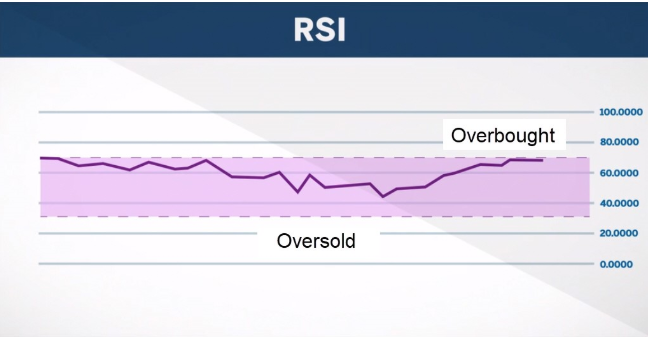
The Relative Strength Index (RSI) serves to measure the speed and strength of the price of a cryptocurrency. A value between 0 and 100 is given by comparing the asset’s current price with its past performance. The general opinion of traders is that cryptocurrencies with an RSI of 70 or higher are overvalued or overbought. Cryptocurrency with an RSI of 30 or below has not seen the required value.
This momentum indicator acts as an oscillator and uses a 14-day timeframe. Overbought is a sell signal. Oversold is a buy signal.
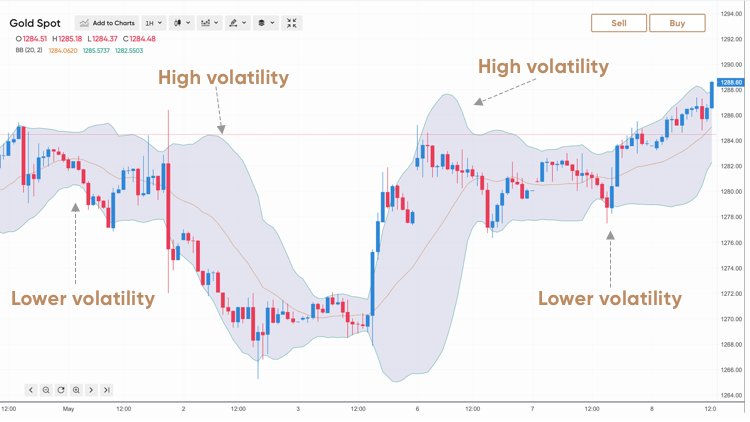
Bollinger Bands
Bollinger Bands, developed by John Bollinger, help traders identify short-term price movements in asset prices, including cryptocurrencies. Bollinger Bands are created using a 20 day moving average and adding and subtracting a standard deviation from the moving average.
Bollinger band parameters can be adjusted, with bands expanding and contracting based on the cryptocurrency’s price. The bands have periods of more or less volatility and should not be used individually, but also with other indicators.
When the price of a cryptocurrency moves above the upper band, it is considered overbought, while a move below the lower band is considered oversold. Bollinger Bands are based on the concept that periods of low volatility are followed by periods of high volatility, meaning that when bands split into periods of high volatility, the sustained trend can end. Likewise, when the bonds are close to each other, the asset may mature during a period of high volatility.
Crypto fear and greed index
First, classic price indices should not be ignored. Seeing price indices and studying fluctuating trends will always be our best source of investment. Some niche maps are useful to facilitate deeper analysis of the crypto market.
A good example is the use of a crypto index of fear and greed. This index takes several measures of crypto market information and compiles them into an easy-to-read chart that provides two valuable insights. The first big offer in this chart is the ability to measure market sentiment on specific cryptocurrencies. When the score begins to fall below 20, analysts call it extreme fear. For more conservative investors, anything over 80 is considered extreme greed, which is just as dangerous.
You can see the crypto fear and greed index here.
Principles of Dow Theory
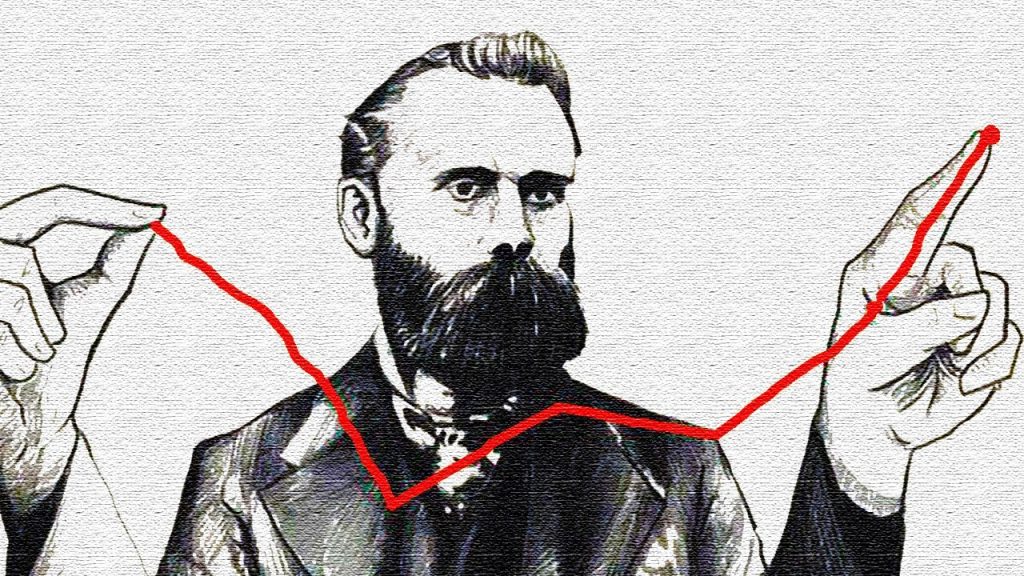
One of the great help in establishing the first stock market index in 1884 came from Charles Dow. Charles Dow believed that the stock market was a reliable way of measuring business conditions in the economy. Dow Theory is based on six basic principles. Thanks to these principles, it is possible to determine the trends of the main market.
The market has three movements – A market can have a main movement such as a bullish or a bearish one. This is called primary movement. It can last from a year to several years and indicates the main trend of prices in the market. The tendency for the prices of assets in the market to rise is called a bull market, and a downward trend is called a bear market. The secondary movement is the medium swing. This movement, which can take between ten days and three months, is measured in terms of the primary price change. Short swing is the name given to movements of several days. It is the name given to the price movements that will be created by short-term speculations. Short oscillation can also be considered as market noise.
Major market trends have three phases – The Accumulation phase is when investors trade cryptocurrencies regardless of what the overall perception of the market is. The absorption stage is also known as the public engagement stage. It is the time when new investors enter the market and start trading as the market grows in popularity. The distribution phase is when long-term investors start taking profits by selling some of their cryptocurrencies.
New information affects prices – The prices of cryptocurrencies in the market will change by following new information and news. The prices of cryptocurrencies are determined by the people who buy and sell them. Therefore, a price will be formed as a result of the fear, hope and expectations of the community. Factors such as the initiatives of the cryptocurrency project, revenues, interest rates, market price, earnings expectations will quickly affect the price. The Efficient Market Hypothesis (EMH) states that the price of the asset reflects all available information.
Different exchanges have the same prices – The same cryptocurrency cannot be traded at two different prices on two different exchanges. The price difference between the two exchanges should be less than 1%. In the past, due to the lack of orders in the order book, the small market volume and the low daily trading volume, arbitrage transactions could be made between exchanges. This is no longer possible.
Volume influences trends – If an uptrend has started, volume should increase with the price of a coin. On the contrary, during the downtrend, a decrease in the volume should be followed with the decrease in the price.
Trends do not end immediately – Once the market enters a trend, the trend will likely continue for a long time. To see a trend end and a market trend reversal, some graphically conclusive evidence is needed. While market noise causes us to see different prices in the short term, it cannot end the trend.
Conclusion
If you know how to read cryptocurrency charts, you are likely to profit from your cryptocurrency trading. You can start crypto trading as a result of the technical analysis you will make by reading the various charts, examining the charts and using the indicators. Do not ignore the six principles of Dow Theory during your trading. By drawing trend lines on Japanese candlestick charts, you can identify support and resistance levels so you can predict future prices.


