When operating a site for commercial purposes, access analysis is indispensable in order to increase the CVR (customer conversion rate = percentage of users who actually conducted commercial transactions ).
One of the most famous analytics tools is Google Analytics, but there are some things you can’t do with this tool alone. So, in addition to Google Analytics, a heat map also can be used at the same time.
In this article, we’ll discuss the features and differences between Google Analytics and heatmaps, as well as the effectiveness of using both tools at the same time.
What is a heat map?
Google Analytics is well-known as a tool for analyzing websites, but recently, heat maps have also been attracting attention as an analysis tool with functions that Google Analytics does not have.
Let’s take a look at what kind of tool a heat map is.
Visualize user movements
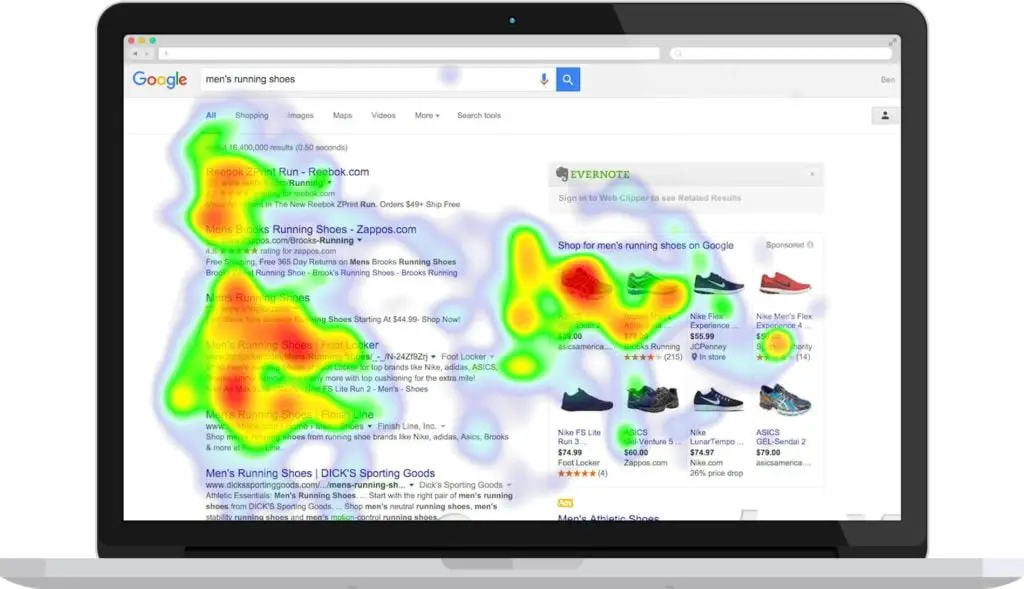
A heat map is a tool that allows you to visualize the movements of a user’s mouse or scroll button when visiting a website, using colors and shades like a map. The redder the color displayed, the higher the value or percentage, and the more attention the user is paying to the location.

The greatest feature of heat maps is that they show the user’s movements in a way that is immediately visible to the eye. You can instantly understand what and where users tend to focus their attention within a site.
Understand the direction of site improvement
Heat maps present a “click heat map” that shows where users are clicking frequently, an “attention heat map” shows where users are looking closely, and a “scroll heat map” allows you to visually see how far users have scrolled.
One of the major advantages of using these heatmaps is that they can give you an idea of where to improve your site, such as reviewing the areas of your site that are not attracting users’ attention or increasing the number of attention-grabbing areas within a page. If you can improve those areas on the page it will help increase your CVR.
What is the difference between heat maps and Google Analytics?
In this section, we will introduce the functions of Google Analytics, and then explain in detail the differences between Google Analytics and heat maps.
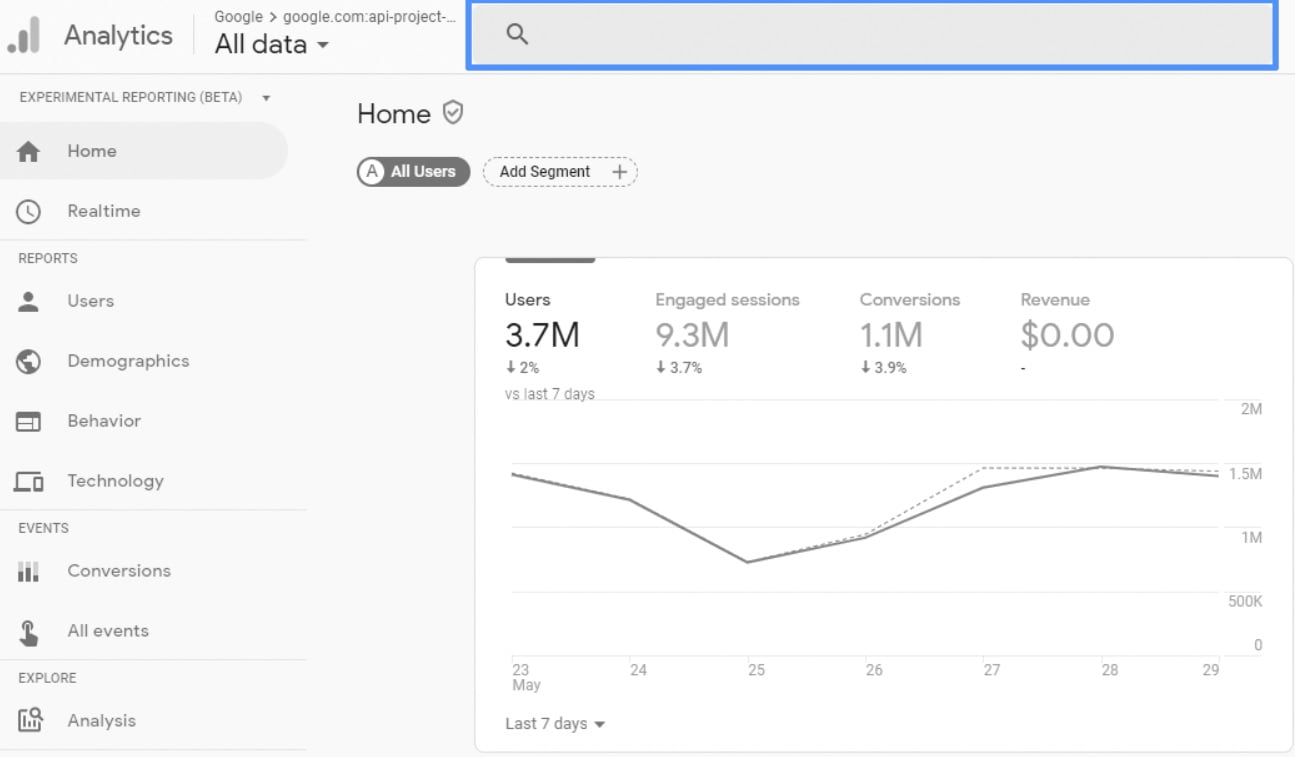
Google Analytics is a tool for access analysis
By linking your website to Google Analytics, you can learn the following main things.

Time spent on the site by users
You can learn how the number of pages being viewed has changed over time, and which pages are currently being viewed.
Devices used to view the site
You can learn the device information of users. You can see from which device the user is accessing the site such as smartphones or PCs.
Where did they come from?
You can analyze how the user came to this site. You can analyze how the user came to your site, whether they searched on a search engine, clicked on a banner ad, added your site to their “favorites,” came from a link on another site, came from SNS, came from a listing ad, came from a link in an email, etc.
User movement
You can see the number of pages viewed (page views) when users visit your site, the number of visitors to each page, the time spent on each page, the bounce rate (the percentage of users who leave the page without taking any action), and the abandonment rate (the percentage of users who leave the site without viewing all the content on the page). Reducing the bounce rate is especially important for improving CVR.

Analyze how well your website is achieving its goals
You can check the data related to the goals your website has set. For example, if your website is a mail order site, you can see how well your products are selling. By entering the goals in advance, you can check how many goals have been achieved, etc.
What are the differences between Google Analytics and heat maps?
Google Analytics can cover most of the access status of the website you are running, but it can only check information from the “operator’s perspective. You can quantify and understand the number of user visits, inflow sources, time spent on the page, etc., but you cannot fully analyze from the “visitor’s perspective.
For example, Google Analytics is not sufficient for analyzing the detailed movements of users on a site, such as where they are looking at a page and whether they are clicking where they want to click.
Heat maps, on the other hand, are characterized by their ability to show the user’s movements on each page of the site in colors and shades, just like heat detection. You can see if the parts of the page you want people to check out, click on, or read are leading them to the right place.
In other words, while Google Analytics shows you the access status of each page, such as which pages users visit most often and where they came from, heat maps show you the specific movements of users within each page.


